Parallax Launches Simon Cowell Infographic for Lemoncake
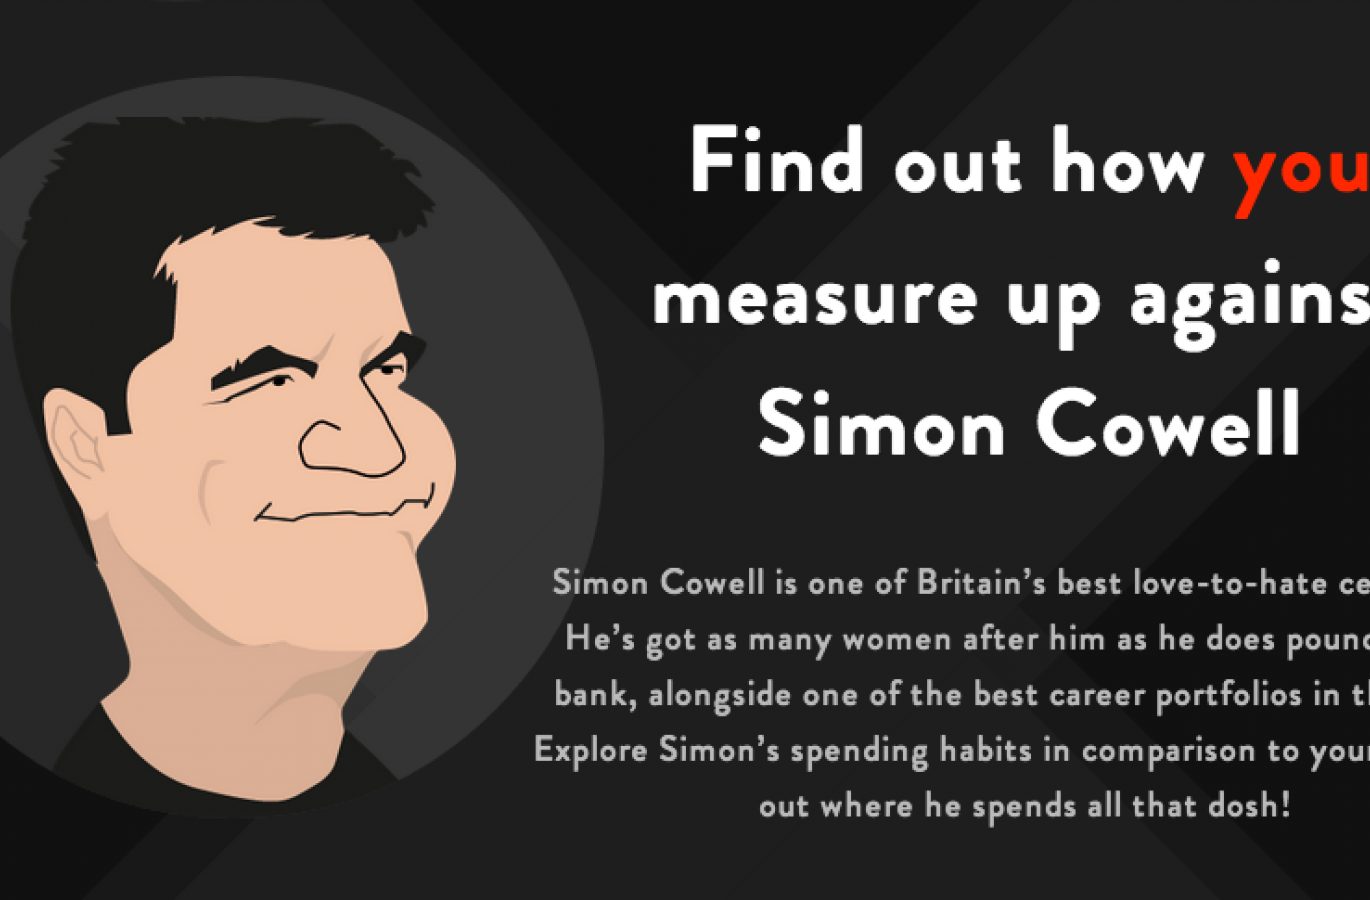
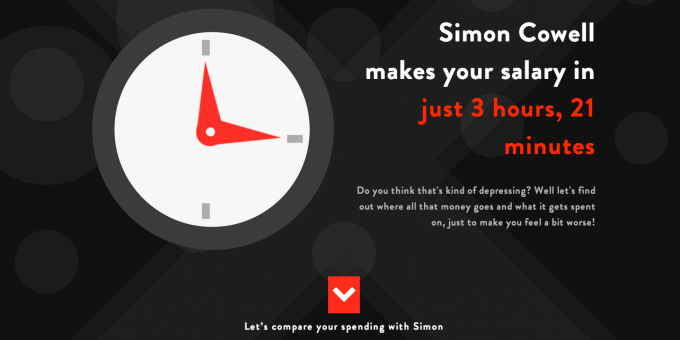
We’re proud to unveil our latest interactive infographic, You vs Simon Cowell. The infographic has a precisely planned content structure, telling the story of your spending and salary against Simon Cowell and how quickly he earns your annual income.
We’ve carefully structured and created the story of You vs Simon Cowell for our client Lemoncake a production music library which we launched in October. Creating shareable and engaging content is part of the ongoing marketing work we are on with Lemoncake.
Jamie who designed the infographic said:
The aim was to create something which was immersive though the use of a clear user path. We wanted something that was fun, so having custom-drawn caricatures of the X Factor judges seemed like a good way to humanise and set the tone.
The content was the focal point of the design, so the typography was very carefully considered. We subtly used the X Factor’s brand colours throughout, against a slick black background to let the content do the talking. We worked closely with the content team to ensure each word fit within the design; every pixel counted!
It was definitely been one of my favourite projects to work on, the whole team has enjoyed seeing it come to life from the wireframing to the build – I think we’re all thrilled with the results!
What has Simon Cowell got to do with Lemoncake?
When ranking a website for keywords, Google looks for the number of links that point to a particular domain. Linkable assets or ‘link bait’ is often created to encourage websites around the world to link to a website. So when you see viral content flying around the web and share it with your friends and family either through your website, blog or social media, you are contributing to the authority of that domain.
This has a great effect on that domain’s rankings on Google’s results pages. To learn more about linkable assets and off site SEO head to our blog.
Creating an infographic
We’ve broken down the five key steps to creating an infographic –
Idea Generation
At Parallax we have a pool of ideas that we regularly use. Some ideas for fun and shareable content may be amazing and need refining, whilst others may not be so strong, however they can often lead to other opportunities or angles. You’ll need to find an idea that is of interest, is possible to create, and that ultimately you think people will share and link to.
Content Plan
Often infographics are based on solid information or statistics. Many of the infographics Parallax creates are more complex and tell stories. It’s best to plan out how you want to tell this story as early as possible. What are the most interesting bits? How can you make the most of them? How is your content going to make the user feel? Most importantly, what about the content will make it shareable? Fitting these ideas around the copy and logic behind the infographic can be challenging but very rewarding.
Have a clear plan of the copy and data you want to display.
Design
Meeting early with a designer about your infographic is the best idea. This can help you decide how you want to engage the user with content and how the copy might have to be altered or if the context of it needs changing. The design stage really brings together the content and as you visualise the content plan you can start to discuss with your development team how the interactive sections will work. For the Simon Cowell infographic, our content team worked with our designers and developers from the word go to make sure the process would be as smooth as possible, also ensuring that everybody was on the same page.
Development
Once the copy and design is in place we send the files to our development team who work meticulously on the interactive elements of the infographic. For the Simon Cowell infographic, there were many small fixes we had to consider – from user salary value issues, to the logic behind how the content that was rendered. This on top of the transitions and overall UX add up to create a number of challenges that need to be overcome.
Testing
After spending time creating the outline, content, design and interactive elements which create your infographic, you’ll need to be 100% sure that once it’s released, everything works seamlessly. There’s nothing worse than releasing a website or infographic and finding glitches or issues.
What’s next?
Now you’ve spent so much time on creating this infographic what do you do with it?
Go out and get exposure: links, tweets, shares, and discussions. During the creation of your infographic you should build up a list who you wish to target. Who will find this content most interesting? Who will talk about it? Who will share and link to it?
The Simon Cowell piece naturally covers a huge target market, however, there are particular journalists and websites that we know will be most likely to talk about this piece of content. Choosing a generic or topical piece will be very beneficial. For example a Leeds business might think about creating a Tour de Yorkshire infographic for 2014.
Have you seen any awesome infographics or want to talk more about online marketing and link bait? Give us a nudge on Twitter or send us an email.